
Apple Pay, Google Pay or card. No account needed to pay. Unused reports refunded within 7 days.
Not sure yet? See a sample reportMarket intelligence for entrepreneurs
Find out if your business idea
will actually work.
Real Census, BLS and competitor data for any industry in any US city. One report with your Neur Score™, a competitor map and a step-by-step plan. $59.99, ready in five minutes.
- +7.6%
- Food trucks & mobile food, fastest-growing this quarter
- 221
- business types modeled
- 50
- states, every county
- 5 min
- to a scored report
Data from the US Census Bureau · Bureau of Labor Statistics · Google Maps
How it works
From idea to a data-backed decision
- 01
Tell us about your idea
Seven questions: the business, the city, your budget, your customer, your experience. Under five minutes, no spreadsheet.
- 02
Neur pulls the data
Census demographics within a drive, BLS jobs and wages for the county, every competitor on Google Maps with its rating and price level.
- 03
Explore the report online
The Neur Score™ and its five pillars, a competitor map with the zones ranked, daytime workers next to residents, and a financial model you can edit.
- 04
Take the PDF to the bank
A Quick Report for you and a Lender Report formatted for an SBA or bank application, with every figure sourced and dated.
The quarter in one chart
The same data every report is built on, one quarter at a time.
Fourteen business types first-time owners open most, ranked by jobs added over the year, from the Bureau of Labor Statistics. When a new quarter publishes, this chart, the state rankings and the reports update together.
United States · 2026 Q1 · hover a row for establishments and wages
- Food trucks & mobile food+7.6%
- Coffee shops & cafés+5.6%
- Gyms & fitness studios+4.0%
- Pet care & grooming+2.5%
- Nail salons+2.1%
- Quick-service restaurants+0.2%
- Cleaning & janitorial-0.1%
- Auto repair shops-0.2%
- Full-service restaurants-0.4%
- Hair & beauty salons-0.8%
- Child day care-1.1%
- Landscaping services-1.4%
- Bars & taverns-2.0%
- Dry cleaning & laundry-2.9%
Table view
| Business type | Jobs YoY | Establishments | Avg weekly wage |
|---|---|---|---|
| Food trucks & mobile food | +7.6% | 13,075 | $523 |
| Coffee shops & cafés | +5.6% | 89,512 | $474 |
| Gyms & fitness studios | +4.0% | 47,160 | $443 |
| Pet care & grooming | +2.5% | 28,651 | $603 |
| Nail salons | +2.1% | 34,585 | $500 |
| Quick-service restaurants | +0.2% | 272,118 | $464 |
| Cleaning & janitorial | -0.1% | 83,480 | $664 |
| Auto repair shops | -0.2% | 86,416 | $1,155 |
| Full-service restaurants | -0.4% | 265,527 | $602 |
| Hair & beauty salons | -0.8% | 77,594 | $670 |
| Child day care | -1.1% | 79,617 | $632 |
| Landscaping services | -1.4% | 124,018 | $971 |
| Bars & taverns | -2.0% | 41,912 | $515 |
| Dry cleaning & laundry | -2.9% | 14,031 | $629 |
Sample Report
See What You Get
A real Neur report for a coffee shop in San Antonio, Texas, run in September 2026. Yours is built the same way for your industry, your city and your budget. The data is public; the Neur Score™ is ours.
Business Analysis Report
Coffee Shop
San Antonio, Texas
74/100
Promising
Neur Score™
Score Breakdown
14
Market
11
Competition
18
Location
16
Financial
14
Personal
1,445,662
Population
$59,593
Median Income
+1.0%
Employment Growth
60
Competitors Nearby
Key Strengths
+Strong location indicators: cost, foot traffic potential and reach align well for a coffee shop
+Food & Beverage has a workable market here with one or two soft spots the report names
+Your $100k budget is solid relative to typical startup costs for this industry
Next Steps
1Visit your top 5 local competitors and document pricing, service gaps and reviews
2Register your business as an LLC with the State of Texas
3Apply for your free EIN at irs.gov
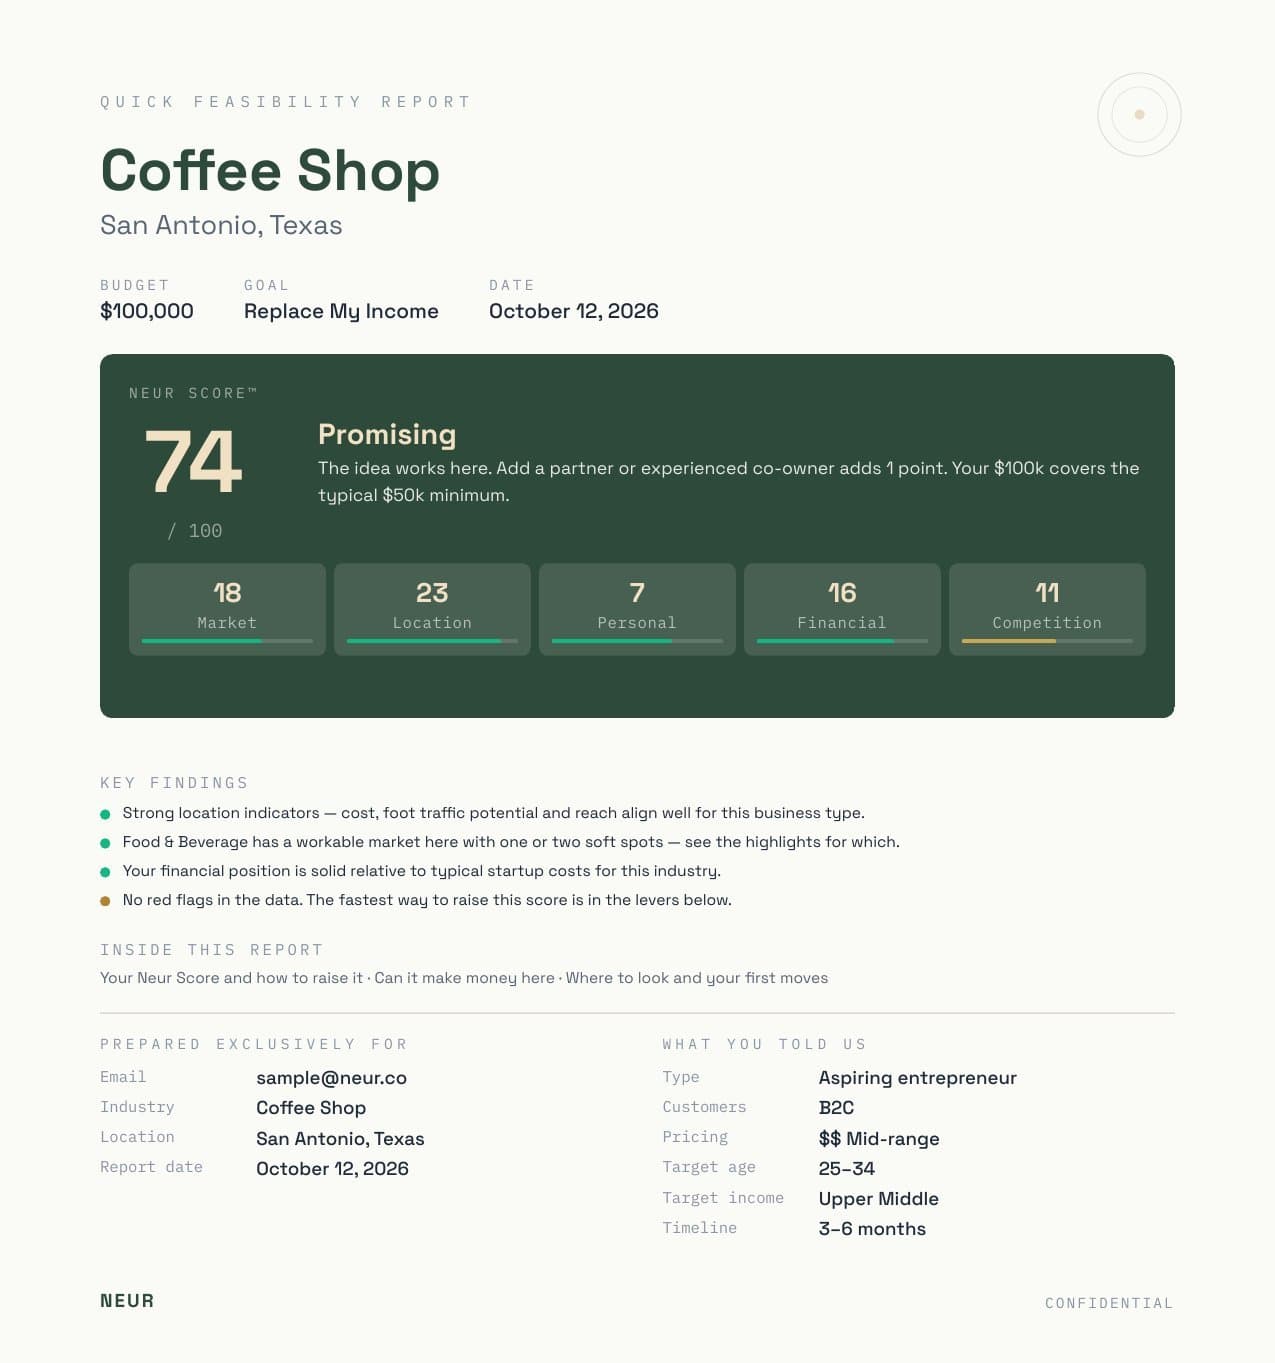
The full report
Three pages: your score and how to raise it, the money, where to look, and your first moves.
The actual Quick Report for this San Antonio coffee shop. Every purchase also includes the full Lender Report. Open the sample (PDF)
Apple Pay, Google Pay or card. Fails to generate? Automatic refund. Unused? Refunded within 7 days.
What a report answers
The wrong location costs six figures. The right data costs $59.99.
47 vs 23
coffee competitors, Austin vs Denver, same demographics
Two cities, same coffee shop, very different odds
Austin looks perfect on paper: high income, strong foot traffic. A report maps 47 competitors across the metro. Denver shows half the competition with similar demographics and lower rent. That is the difference between a price war and a head start.
74
Neur Score for a coffee shop in San Antonio, the real sample report

Every number shows its source
A real run: the score and its five pillars, the competitor map, the financial estimate and the action plan. Each figure names the dataset and the year it came from, so a lender can check it.
+7.6%
Food trucks & mobile food, jobs added over the year, United States, 2026 Q1
The data is live, not a brochure
Every report draws on the same BLS feed that ranks the fastest-growing business types for all 50 states. When BLS publishes a new quarter, the rankings, the widget and the reports update with it.
Pricing
Get clear answers before you commit capital
One report gives you the market data, competition analysis, and Neur Score™ you need to make a confident decision. Reports never expire.
Single Report
$59.99
one-time
Best for validating one business idea with full market data and insights.
- 1 full report
- Full demographics, competition, and labor data
- Neur Score™ with 5-pillar breakdown
- PDF download and action plan
Apple Pay, Google Pay or card.
Unused reports refunded within 7 days.
Best Value
Explorer Pack
$149.99
$50 each — save $30
Best for comparing multiple locations or testing different business ideas.
- 3 full reports
- Compare cities, industries, or approaches
- All PDF downloads included
- Reports never expire — use them whenever
Apple Pay, Google Pay or card.
Unused reports refunded within 7 days.
Unused reports are refundable within 7 days. Once a report is generated it is yours to keep and is not refundable.
Before you buy
Questions people ask first
Short answers. One report is $59.99, no subscription.
An interactive report in your dashboard and two PDFs: a three-page Quick Report and the full Lender Report. Inside: your Neur Score™ out of 100 with its five pillars and what would raise it, a competitor map with recommended zones, local demographics and labor data, a financial estimate with break-even, and a step-by-step action plan for your business in your state.
The data is public; the score is ours. The Neur Score™ is Neur's own model: five weighted pillars built from US Census, Bureau of Labor Statistics and Google Maps data plus Neur's operating models for 108 industries. It is an estimate, not a prediction. It is most useful for comparing cities or ideas and for spotting problems before you sign a lease. Every number shows its source, and the report tells you which inputs would move the score.
No. You pay first with Apple Pay, Google Pay or a card. Your account is created from the email you use at checkout, and you sign in with a link sent to that address.
Yes. The Lender Report is built for that: a lender snapshot with startup capital, financing gap, expected revenue and break-even, an applicant page from your answers, and the data behind every figure. It is formatted as the market-research section of an SBA or bank application: every figure sourced and dated.
Unused reports are refunded within 7 days of purchase. Once a report has been generated it is yours to keep and is not refundable, except when generation fails, in which case the report is returned to your account automatically.
Seven questions, about five minutes. The report is ready a few minutes later and stays in your dashboard. Each purchase covers one business in one city; the three-report pack is for comparing cities or ideas.
More questions, including refunds in detail and what the score labels mean: the full FAQ
Latest from Insights
 What an SBA Lender Actually Checks in a Start-Up’s Projections (the Rule, Quoted)Oct 12, 2026 · 8 min read1.15minimum debt service coverage a start-up projection must reach within two years of funding, under SBA SOP 50 10 8
 The 14 Most Common Small Businesses, Ranked by Job Growth in 2026Oct 8, 2026 · 4 min read+7.6%jobs added by food trucks, the fastest of 14 types
 Food Trucks Are the Fastest-Growing Small Business in 22 StatesOct 8, 2026 · 4 min read22states where food trucks lead the growth ranking
 How Crowded Is Your Business Type? Establishments per 100,000 People for 14 Common BusinessesOct 8, 2026 · 4 min read77full-service restaurants per 100,000 Americans
 What a Lender Reads First: Inside a Startup Loan DecisionOct 8, 2026 · 5 min read42%of applicants got the full amount they asked for
Free tools
What business should I open?
Give Neur a city, a budget and what you like doing. It ranks about a hundred business types by room in your county, cost and fit, and picks five.
Let Neur pickIs my city saturated?
Establishments per 100,000 residents in your county against the state and the US, for 14 business types. Census data, instant.
Check a cityFastest-growing businesses by state
Fourteen business types ranked by jobs added over the year, for all 50 states, from BLS employment data. Updated each quarter.
See the rankingsA widget for your website
One line of HTML shows your state’s five fastest-growing small businesses on your site. For chambers, SBDCs, lenders and brokers.
Get the codeOne business, one city, one answer
Put real numbers behind the decision before you sign anything.
Seven questions, five minutes, $59.99. The competitor map, the demographics, the local wages, the financial model and the score, with the levers that would raise it.
Apple Pay, Google Pay or card. Fails to generate? Automatic refund. Unused? Refunded within 7 days.